
Depth of Delay KPI: Calculate Supplier Delays and Backlog Severity | Inventory Big Data
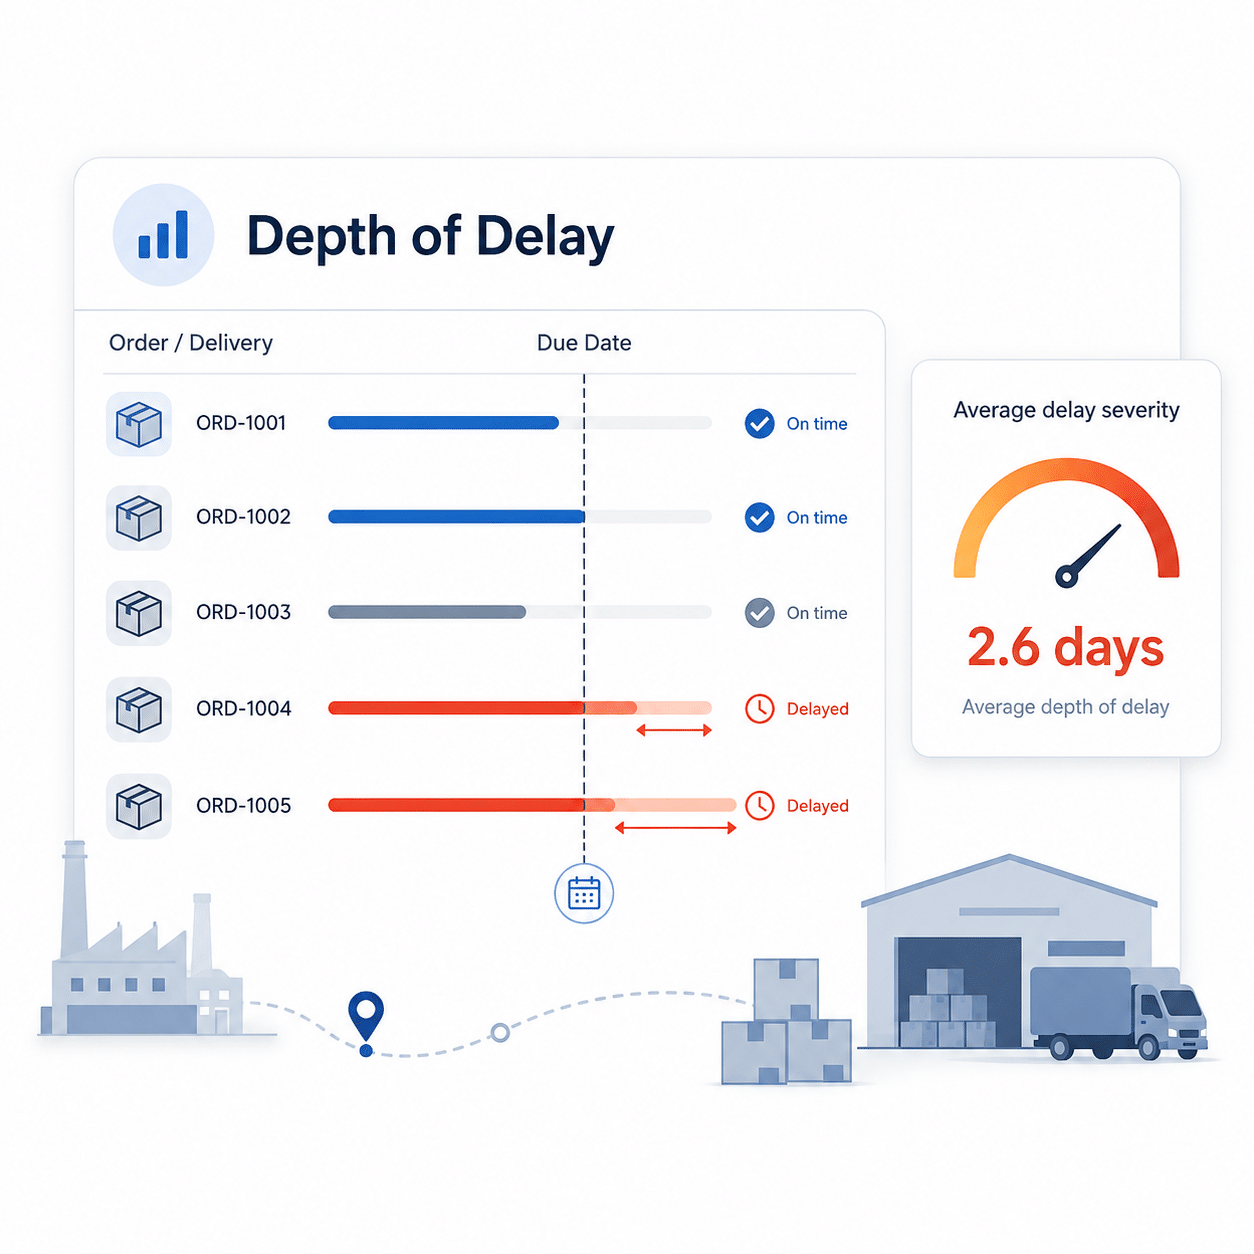
Depth of Delay is a supply chain KPI used to measure the severity of late order lines, supplier delays and backlog. It helps industrial teams prioritize recovery actions, improve service level and reduce operational risk.
Description
What is Depth of Delay?
Depth of Delay measures the number of days accumulated by late lines. It can be used as an average delay, a maximum delay or a weighted delay depending on the operational question.
In practice, the most useful version for supply chain monitoring is the average depth of delay:
Average Depth of Delay = Total delay days / Number of late lines
This makes the KPI more precise than simply counting late orders. Two suppliers can have the same number of late lines, but one supplier may have a much deeper delay and therefore a higher operational impact.
Depth of Delay formula
| KPI | Formula | Use case |
|---|---|---|
| Average Depth of Delay | Total delay days / Number of late lines | Measure the average severity of late lines. |
| Maximum Depth of Delay | Highest number of delay days among late lines | Identify the oldest or most critical late order. |
| Weighted Depth of Delay | Sum of delay days weighted by quantity, value or priority | Prioritize delays according to business impact. |
Example of Depth of Delay calculation
A supplier has 5 late purchase order lines:
| Order line | Delay in days |
|---|---|
| Line 1 | 3 days |
| Line 2 | 5 days |
| Line 3 | 8 days |
| Line 4 | 12 days |
| Line 5 | 22 days |
Total delay days = 3 + 5 + 8 + 12 + 22 = 50 days.
Average Depth of Delay = 50 / 5 = 10 days.
Maximum Depth of Delay = 22 days.
This means that the supplier is not only late on 5 lines. The average severity of the delay is 10 days, and the most critical line is already 22 days late.
Why Depth of Delay matters
Counting late lines is useful, but it does not show the severity of the situation. Depth of Delay adds a qualitative dimension to delay management.
- It identifies suppliers with the most severe delivery delays.
- It helps prioritize recovery actions instead of treating all late lines the same way.
- It improves the visibility of backlog severity.
- It supports service-level improvement and customer delivery protection.
- It helps supply chain teams separate minor delays from critical delays.
Depth of Delay versus On-Time Delivery
On-Time Delivery measures the percentage of orders delivered on time. It is a key service-level indicator, but it does not explain how severe the late deliveries are.
Depth of Delay completes OTD by measuring how deep the delay is.
| Indicator | What it measures | Main limitation |
|---|---|---|
| OTD | Percentage of orders delivered on time | Does not measure delay severity. |
| Number of late lines | Volume of delayed order lines | Does not show how late they are. |
| Depth of Delay | Severity of delay in days | Must be interpreted with priority, value and operational impact. |
How to use Depth of Delay in supplier performance
Depth of Delay is particularly effective when used in supplier performance dashboards. It helps supply managers identify which suppliers require immediate action.
- Supplier A may have many late lines but only a low average delay.
- Supplier B may have fewer late lines but a very high delay depth.
- Supplier C may have a small number of critical delays on high-value or production-blocking items.
In this case, supplier recovery should not be based only on the number of late lines. The priority should consider delay depth, item criticality, customer impact and production risk.
Recommended dashboard indicators
A complete delay monitoring dashboard should combine several indicators:
- Number of late order lines
- Total accumulated delay days
- Average Depth of Delay
- Maximum Depth of Delay
- On-Time Delivery rate
- Late quantities
- Late value
- Top delayed suppliers
- Top delayed references
- Critical customer or production impact
Excel calculation method
Depth of Delay can be calculated from a simple ERP export containing order line dates.
| Required field | Purpose |
|---|---|
| Order number | Identify the purchase order or customer order. |
| Order line | Measure delay at line level. |
| Supplier or customer | Group delay performance by partner. |
| Expected delivery date | Define the contractual or planned date. |
| Actual delivery date or current date | Calculate the delay in days. |
| Quantity and value | Weight the delay by operational or financial impact. |
In Excel, a simple delay calculation can be built with this logic:
Delay days = MAX(0, Actual delivery date – Expected delivery date)
For open late orders, the current date can be used instead of the actual delivery date:
Open delay days = MAX(0, TODAY() – Expected delivery date)
How to interpret the result
A high Depth of Delay does not automatically mean that every delay has the same priority. The KPI must be connected with business context.
- A 20-day delay on a non-critical item may be less urgent than a 4-day delay on a production-blocking component.
- A supplier with stable low delays may require monitoring, not escalation.
- A supplier with increasing delay depth should trigger corrective actions.
- Weighted delay depth can help prioritize high-value or high-risk items.
Actions to reduce Depth of Delay
Once the KPI is measured, the next step is to convert the analysis into an operational action plan.
- Classify late lines by supplier, item, customer and priority.
- Identify the oldest delays and production-blocking references.
- Separate structural supplier issues from isolated incidents.
- Use ABC or ABClog classification to connect delay risk with inventory value.
- Review planning parameters, lead times and safety stock rules.
- Monitor delay evolution weekly until the backlog is under control.
What Depth of Delay should not be confused with
Depth of Delay should not be confused with production capacity utilization, theoretical production rate or general workshop efficiency. Those indicators are useful, but they answer a different question.
Depth of Delay focuses on lateness and backlog severity. It is mainly used to understand the impact of delays on service level, supplier performance, order management and operational risk.
Related resources
To go further on inventory and delay analysis, you can explore these resources:


